Introduction
Map Functions
This topic shows you the map functions on the interface and how to apply various layers to the map. You will learn how to save map images and include them in the flight package.
We estimate that this will take 15 minutes to complete.
Detailed Explanation
Map Features
The Map graphically represents route information, weather overlay, terrain data, and restricted areas. There are five main areas:
- Search bar
- Zoom in / out slider
- Overlay menus
- Save button
- Expand / Collapse map arrow.
Hover over each area for expanded explanations.
The Search bar allows you to search for specific items such as airports, waypoints or FIRs. You can search for multiple items by separating them with a comma.
The Zoom In/Out slider allows users to expand or minimize the area they are reviewing.
The overlay menu options categorize the types of layers you can add to your map screen. These will be discussed in depth during this module.
The Save button allows users to save a copy of their map and send it with their flight release.
Click on the triangle on the bottom right of the screen to expand the map or collapse the map on your screen.
Map - Search Bar
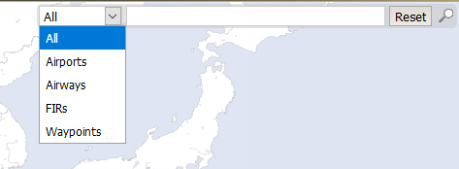
The search bar on the Map screen allows users to search for anything on the map and have it highlighted for quick reference. Users can search for multiple items when separated with a comma or specific categories.

![]() Click the Search bar input field.
Click the Search bar input field.
HINT
Available Search categories:
All - allows a search over multiple categories.
Airports - e.g.: SYD or YSSY
Airways - e.g.: A457
FIRs - e.g.: WSJC
Waypoints - e.g.: VMR, TUNTO
Sectors - e.g.: ACCWEINEP1
ATM (Air Traffic Management) - e.g.: LECSRTA
RestrictedAreas - e.g.: restricted areas are published by the country or aviation authority (e.g. FAA, Transport Canada).
NOTAM Restricted Areas - allows users to search for NOTAM areas by entering a specific NOTAM identifie (e.g.: KZMA_A0912/25).
![]() Enter VHHH, M501 into the Search bar field.
Enter VHHH, M501 into the Search bar field.
In this search, we will identify an airport and an airway. To search multiple items, separate them with a comma.
HINT
You can also use the search function to plot latitude and longitude. Enter the lat/long (use a comma to separate) and click the search icon to view the coordinates on the map.
![]() Press the
Press the ![]() key.
key.

![]() Click the Reset button.
Click the Reset button.
You can also use the search function to plot latitude and longitude. Enter the lat/long (use a comma to separate) and click the search icon to view the coordinates on the map.
HINT
To reset previous queries, select the Reset button next to the Search bar.
Map - Overlay Buttons
The Overlay Buttons allow users to add or remove various layers to their map. You can add as many layers as you would like to the map and this is user specific, meaning other users will not be able to view or change your map.
![]()
Map - Map Button
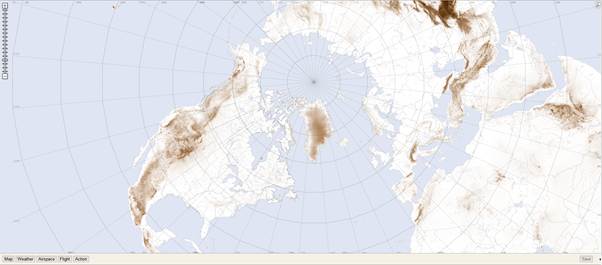
The Map overlay button allows the user to pull up the latitude and longitude as well as the terrain of an area for reference.

![]() Click the Map button.
Click the Map button.
![]() Click the Projection list item.
Click the Projection list item.
HINT
Selecting Projection allows you to select the type of projection grid to display on the Map using radio buttons. Choices are:
-Plate Carree
-Mercator
-Polar Stereographic (North)
-Polar Stereographic (South).

![]() Click the Terrain check box.
Click the Terrain check box.
HINT
Terrain: Selecting the Terrain checkbox causes the terrain to appear on the map. When terrain is selected, the elevation (in feet) can be displayed anywhere on the map by right clicking on the mouse.
Grid: Selecting the Grid checkbox causes a grid to be overlaid on the map. The type of grid selected under the Projection fly-out.
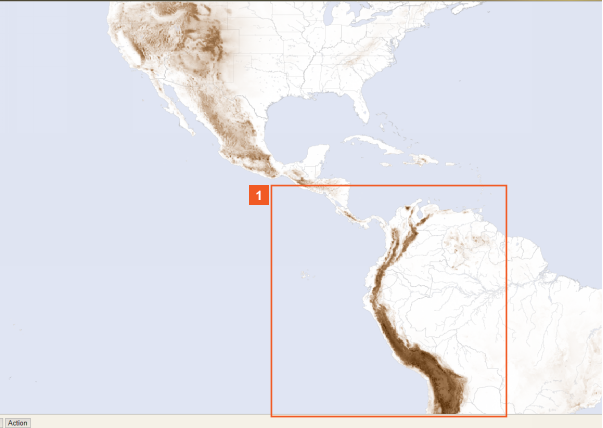
![]() Right-click: the Andes in South America on the map.
Right-click: the Andes in South America on the map.

HINT
Right-clicking over an area displays the coordinates, country, and elevation at that specific area. Also, hovering over these options will give you additional information.
Map - Weather Button

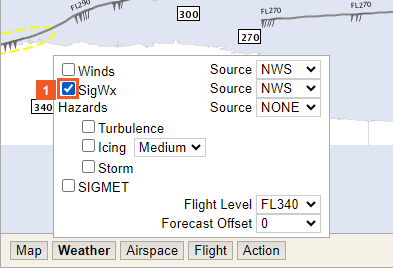
The Weather overlay button allows the Dispatcher to show hazards such as turbulence, icing, and thunderstorms at various flight levels and intervals to assist in flight planning.

![]() Click the Weather button.
Click the Weather button.
![]() Click the Winds check box.
Click the Winds check box.
Selecting Winds allows you to select the checkbox to overlay winds on the map. The Flight Level dropdown list lets you specify a flight level for which winds will be displayed. The top dropdown menu, across from the Winds checkbox, allows you select the wind source.

![]() Click the Winds check box.
Click the Winds check box.

![]() Click the SigWx check box.
Click the SigWx check box.
Selecting the SigWx checkbox causes SigWx to be overlaid on the Map. The top dropdown menu, across from the SigWx checkbox, allows you select the weather source. The SigWx information is time-stamped on the lower right of the map.
![]() Click the SigWx check box.
Click the SigWx check box.
![]() Click the Turbulence check box.
Click the Turbulence check box.
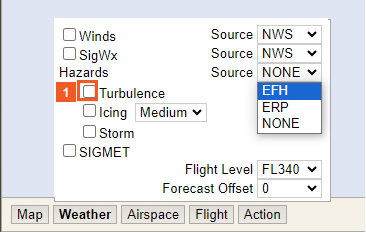
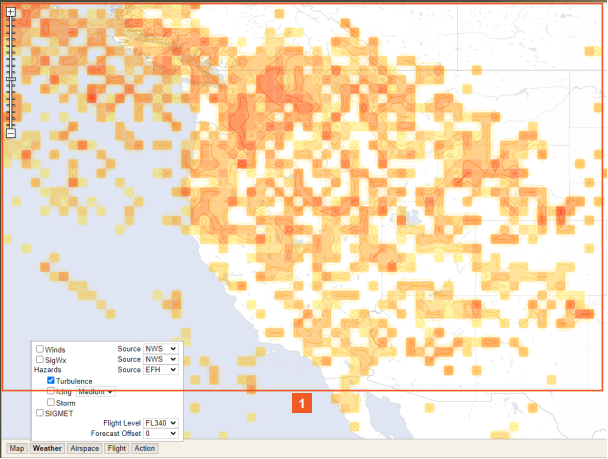
The Turbulence checkbox will display turbulence information on the map. Darker lines on the map indicate higher levels of turbulence. The flight level dropdown list lets you specify the flight level to show the winds.
There are three source options for Hazards:
- EFH
- ERP
- NONE.
Usually the source is preset based on the Airline Code Parameters.
![]() Right-click: the turbulence on the left side of the map.
Right-click: the turbulence on the left side of the map.
HINT
EDR Turbulence Scale
<+ 0.10 --- No Turbulence
0.15-0.25 -- Light Turbulence
0.25-0.45 -- Moderate Turbulence
>= 0.55 -- Severe Turbulence.

![]() Click the Turbulence button.
Click the Turbulence button.
You can view turbulence data on a point on the map or for an airport. Right-click on a point on the map or an airport to view turbulence data. You must have the turbulence checkbox selected to view turbulence data on the map.
![]() Click the Weather button.
Click the Weather button.

![]() Click the Turbulence check box.
Click the Turbulence check box.
![]() Click the Icing check box.
Click the Icing check box.
![]() Click the Icing dropdown button.
Click the Icing dropdown button.
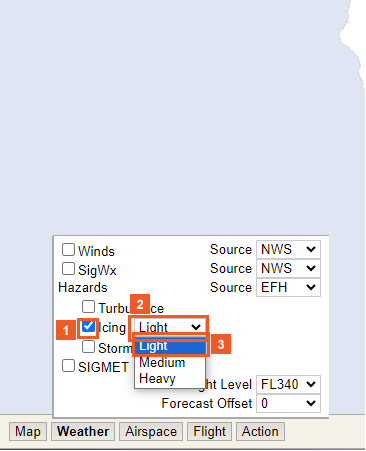
![]() Click the Light list item.
Click the Light list item.
There are three icing options:
- Light
- Moderate
- Heavy.
Icing displays as the light blue to dark blue color on the Map. Select the Icing checkbox and choose the intensity level to display icing on the map.

![]() Click the Flight Level dropdown button.
Click the Flight Level dropdown button.
HINT
Icing is typically displayed for flight level 280 or below, however may be displayed for higher flight levels. Note: Depending on the season, Icing may or may not display on lower or higher flight levels.

![]() Click the Icing check box.
Click the Icing check box.
HINT
Icing is measured in PPI (percent power increase):
-Light (0.0 - 0.1)
-Medium (0.11 - 0.4)
-Heavy (0.4 and above).

![]() Click the Storm check box.
Click the Storm check box.
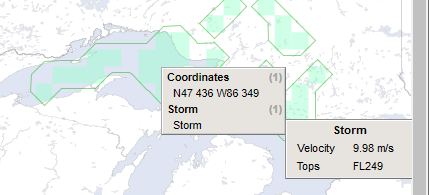
Select the Storm checkbox to display the storm information on the map measured in vertical velocity. Thunderstorm vertical velocity indicates the intensity of the storm.

![]() Right-click: the storm over the Great Lakes.
Right-click: the storm over the Great Lakes.
![]() Click the Storm button.
Click the Storm button.

![]() Click the Weather button.
Click the Weather button.
![]() Click the SIGMET check box.
Click the SIGMET check box.

![]() Right-click the EGPX:02 SEV TURB image.
Right-click the EGPX:02 SEV TURB image.
HINT
SIGMET Color Chart:
Red: Thunderstorm
Orange: Turbulence
Blue: Icing
Gray: Volcanic ash
Green: Cyclone/Hurricane
Cyan: Other/Unknown.
![]() Click the EGPX:02 SEV TURB button.
Click the EGPX:02 SEV TURB button.
You can click on a SIGMET to see additional details.

The details include the Start and End time of the SIGMET including the text details from state published resources.
Map - Airspace Button

The Airspace overlay allows dispatchers to select layers related to airspace which includes Airways, Waypoints, Restricted Areas, Airport, FIRs, Tracks, and ATM.

![]() Click the Airspace button.
Click the Airspace button.
![]() Click the FIRs list item.
Click the FIRs list item.
![]() Click the FIRs check box.
Click the FIRs check box.
Selecting the FIR fly-out allows you to select the FIR checkbox to overlay flight information regions on the map.

![]() Click the Sub-Regions check box.
Click the Sub-Regions check box.
Select the Sub-Regions checkbox to overlay the sub-regions of the flight information regions on the map.
![]() Click the FIR-Warnings check box.
Click the FIR-Warnings check box.
Select the FIR-Warnings checkbox to overlay the FIR areas on the map that defined in the FOMS 394 menu.
ATTENTION
FIR-Warnings only display when there is a warning saved in the FIR Warnings webFOMS.

![]() Click the Flight Level dropdown button.
Click the Flight Level dropdown button.
The FIR fly-out also provides a dropdown list that allows you to specify a flight level to apply to the FIR.
![]() Click the FL150 list item.
Click the FL150 list item.
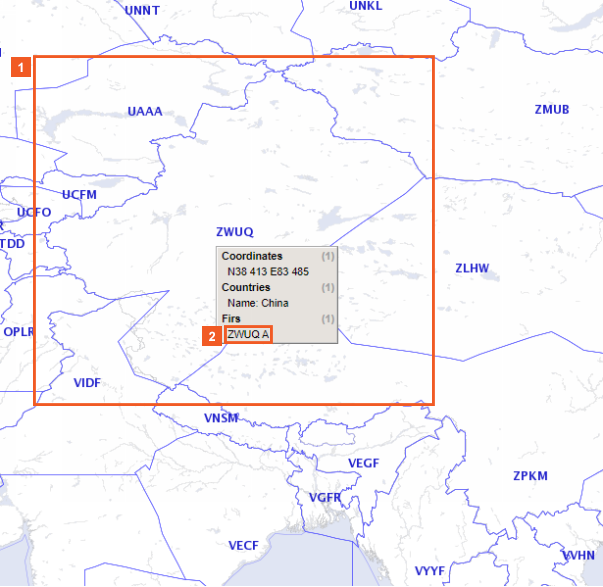
![]() Right-click the the ZWUQ Sub-Region image.
Right-click the the ZWUQ Sub-Region image.
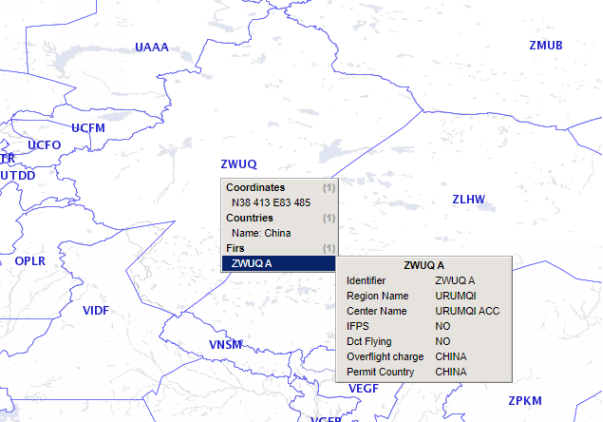
![]() Click the ZWUQ A button.
Click the ZWUQ A button.
You can right-click on a region to view the Identifier, Region Name, Center Name, IFPS, and DCT Flying information.

![]() Click the Airspace button.
Click the Airspace button.
![]() Click the Airways list item.
Click the Airways list item.
Select the Airways checkbox to view airways that are overlaid on the map.
![]() Click the Airways check box.
Click the Airways check box.
Zoom in on the map to display the direction of the airway. You can select to show Lower or Upper airways or you can choose to show both.

![]() Click the Airways check box.
Click the Airways check box.
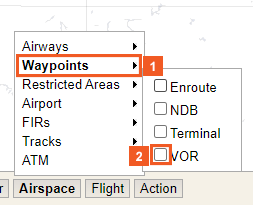
![]() Click the Waypoints list item.
Click the Waypoints list item.
Select the Waypoints fly-out to select the type of waypoints you want to view on the map:
- Enroute
- NDB
- Terminal
- VOR.
![]() Click the VOR check box.
Click the VOR check box.

![]() Click the VOR check box.
Click the VOR check box.
VOR is used in this example. You can right-click on the map to view NAVAIDS if you have selected any of the checkboxes.

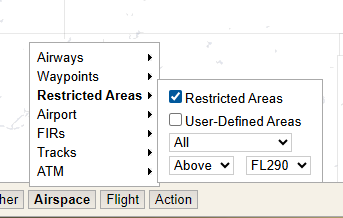
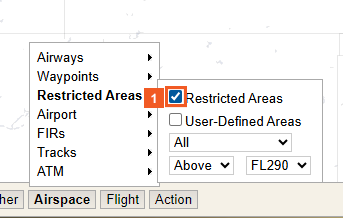
![]() Click the Restricted Areas list item.
Click the Restricted Areas list item.
![]() Click the Restricted Areas check box.
Click the Restricted Areas check box.
Select the Restricted Areas fly-out to select the Restricted Areas checkbox and the User-Defined Areas to overlay restricted areas on the map. The Restricted Areas fly-out also provides three dropdown lists:
- one to display restricted areas by activation type
- one to specify a flight level above or below
- one to select which flight level restricted areas should display.

![]() Click the All dropdown button.
Click the All dropdown button.
![]() Click the All dropdown button.
Click the All dropdown button.
![]() Please click Next to continue.
Please click Next to continue.
This dropdown lets you choose which type of restricted areas display on the map, filtered by activation type. The available options are:
- All
- Active (additional sub-options available)
- Inactive (additional sub-options available).
![]() [!AutoText 'Feedback documentation' could not be generated]
[!AutoText 'Feedback documentation' could not be generated]
![]() Click the Restricted Areas check box.
Click the Restricted Areas check box.
Right-click in a restricted area to see the Name, Type, Min/Max Flight Level, Status, and Time Period the area is active.
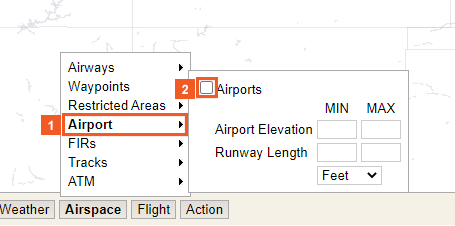
![]() Click the Airport list item.
Click the Airport list item.
Select the Airport fly-out and select the Airport checkbox to overlay airports on the map.
![]() Click the Airports check box.
Click the Airports check box.
The Airports fly-out also provides fields to specify a maximum and minimum runway length (in feet), and a maximum and minimum airport elevation (in feet). Only airports meeting this criteria are displayed.

![]() Click the Airports check box.
Click the Airports check box.
HINT
Right-click on an airport to display:
-ICAO / IATA
-Name / City Name
-Longest Runway
-PCN
-Runway Surface
-Elevation
-Latest METAR
-Latest TAF
-List of all applicable runways.

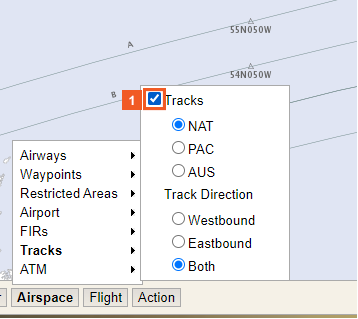
![]() Click the Tracks list item.
Click the Tracks list item.
Select the Tracks fly-out and the Tracks checkbox to overlay tracks on the map.
![]() Click the Tracks check box.
Click the Tracks check box.
The Tracks fly-out provides a radio button list that allows you to specify the Tracks to display.
Choices are:
- NAT: North Atlantic
- PAC: Pacific
- AUS: Australian.
The Tracks fly-out also provides a radio button list that allows you to specify the track direction.
![]() Click the Tracks check box.
Click the Tracks check box.

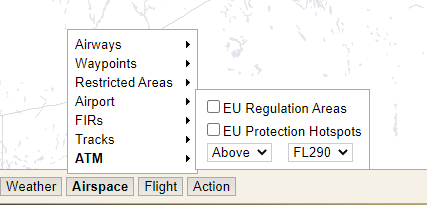
![]() Click the ATM list item.
Click the ATM list item.

![]() Click the Sectors check box.
Click the Sectors check box.
![]() Click the Sectors check box.
Click the Sectors check box.
This map layer for ATM displays ATC sectors and allows them to be used as search parameters.
Note: When searching, enter the sector name without the colon (:) and the sub-sector identifier that follows it (e.g., “001”).
![]() Click the Sectors check box.
Click the Sectors check box.
![]() Click the Sectors check box.
Click the Sectors check box.
![]() Click the EU Regulation Areas check box.
Click the EU Regulation Areas check box.
These map layers for ATM (Air Traffic Management) will display the currently issued Regulation Areas from Eurocontrol Network Manager.
"EU Protection Hotspots" is a feature that is currently in testing by Eurocontrol; however, it is not being used in the Operational Network Manager System at the moment.
![]() Click the EU Regulation Areas check box.
Click the EU Regulation Areas check box.
Right-clicking on any of the Regulation areas will open an information window containing the area vertical limits, start/end times, ID, and area description as published.
Map - Flight Button

The Flight button allows you to display layers on the map specific to the flight you are working on.

![]() Click the Flight button.
Click the Flight button.
![]() Click the ETOPS check box.
Click the ETOPS check box.
Selecting the ETOPS checkbox shows the ETOPS circles on the map. These are only displayed if ETOPS information has been entered in the Plan screen.
![]() Click the ETP check box.
Click the ETP check box.
Select the ETP checkbox to view the equal time points on the map. These are only displayed if ETP information has been entered in the Plan screen.

ATTENTION
Note: Without the ETOPS overlay, the ETP dots appear black.
![]() Right-click: the two green dots side-by-side on the map.
Right-click: the two green dots side-by-side on the map.
![]() Click the Z:99-ALL ENGINE DEPRESS button.
Click the Z:99-ALL ENGINE DEPRESS button.
You can click on the ETP to see the different scenarios that are available along with other information.

Map - Action Button

Use the Action button to erase the layers you have selected and clear the map.
Map - Save Button


Use the Save feature to save the map and layers that you have selected for the flight and add it to the Flight Package.
In order to save a map, enter a name for the image and select the type:
- Flight - only associated with the selected flight and saved in the Custom Map images section.
- CityPair - only associated with flights that contain the city-pair and are saved in CityPair Map section.
- Standard - associated with all flights and are saved in the Standard Map section. The map is saved with the current map layers and auto-zooms to fit the route.